



For supermarket chains
Supermarket chain local SEO and review management: nine thousand reviews.
Parking, queues, empty shelves, self-checkout. A supermarket's rating is decided by store-level operations, not by marketing copy — but the reviews are where the pattern shows up first. Locationes turns that volume into a per-store list someone can act on.
Last updated:
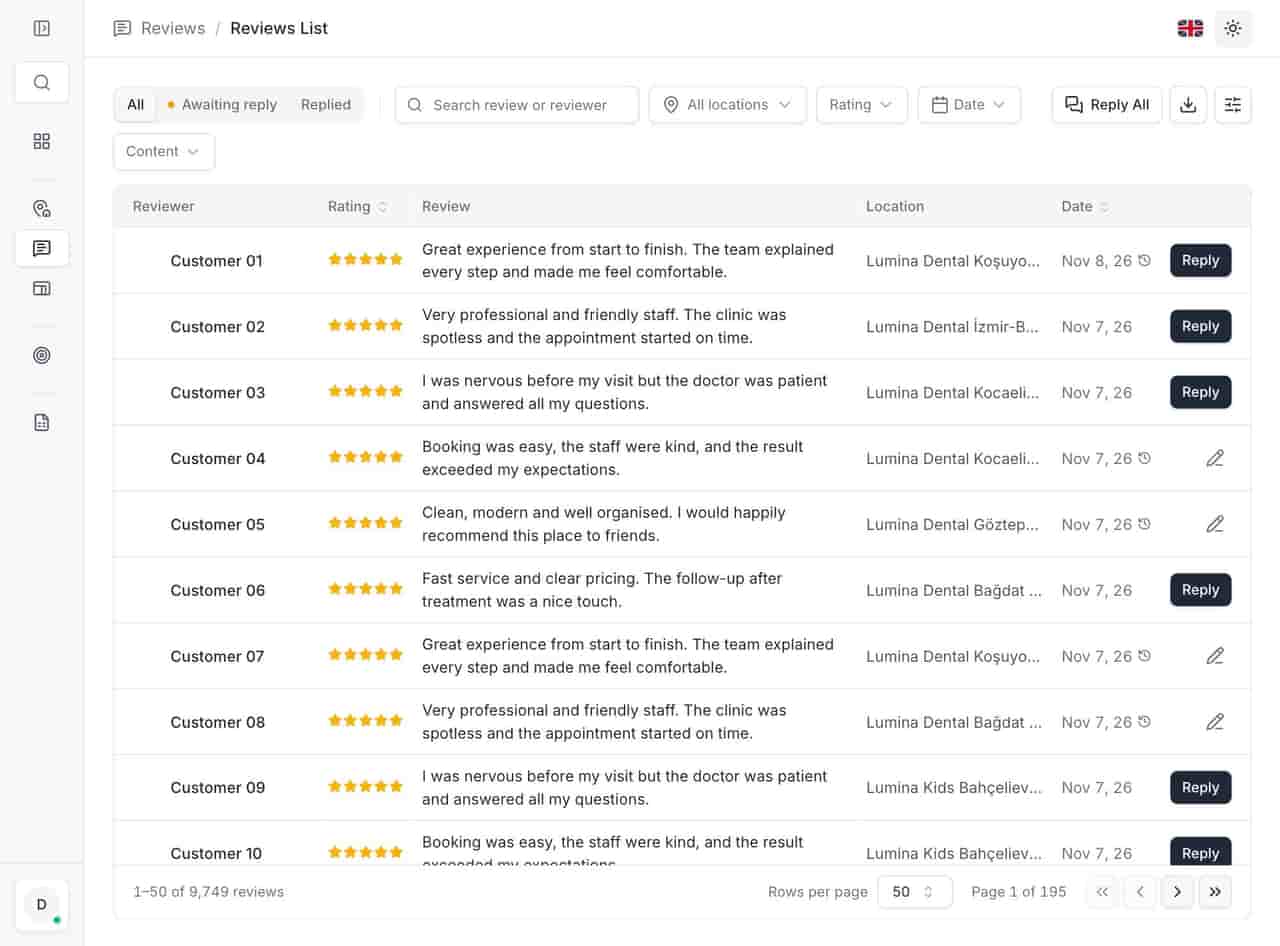
- Reply queue
- Filter by store, rating and text.
- Hours
- Per-store rating breakdown.
- Profiles
- Holiday hours in one bulk update.
- Visibility
- Heat map of low ratings.
The problem
Supermarkets generate more reviews than any other local business, and most of them are short.
That volume hides the signal: a store with 800 reviews can lose a tenth of a star because the car park charges, and nobody notices until the regional review. At the same time, the complaints are not evenly spread and they are not all yours to fix. "Only two tills open" is a staffing decision at one store. "Shelves empty since the refit" is a distribution problem across a region. Treating both as a marketing issue wastes the only thing a review programme can produce: an early, specific list. The third problem is calendar-shaped.
Every bank holiday, dozens of stores publish the wrong hours, and the customers who arrive to a closed door leave the reviews that outlive the mistake.
What it does
Three jobs, in your sector's language.
No generic feature list. The parts of the product that matter when the queue is long and the hours differ.
- Reviews
-
Volume, filtered.
One inbox for every store with tabs for unanswered and answered, filters for location, rating, date and text, plus bulk reply for the routine thank-yous. At thousands of reviews, the only workable approach is to answer the ones that need a person and clear the rest in batches.
- Profiles
-
Store-level truth instead of a chain average.
Rating breakdown per location shows share of 1–2★ reviews and how quickly negatives get answered; the monthly comparison puts two months side by side; the review heat map shows where low ratings cluster geographically. A chain average of 4.3 can hide a store at 3.1.
- Visibility
-
Hours and profiles that survive a bank holiday.
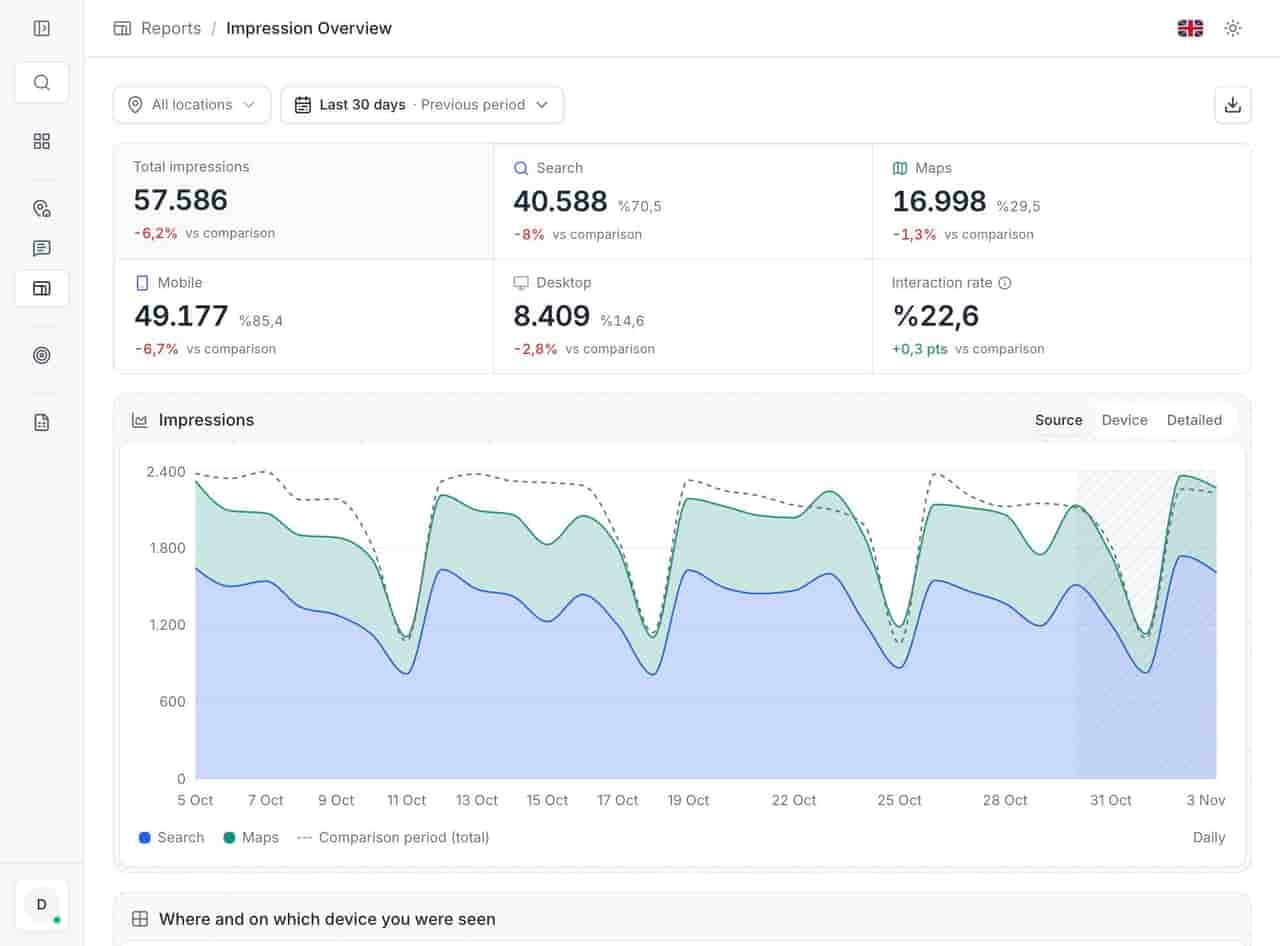
Opening hours are a profile field, so a bulk update covers every store that shares the holiday schedule, followed by the profile audit to catch the ones where it did not land. The profile score also flags missing photos, services and descriptions store by store.
Example scenario
Example scenario
Illustrative example, not a customer story.
A regional supermarket group runs 90 stores. The customer service lead opens the action list on a Tuesday: 60 unanswered negative reviews, spread across 22 stores, with a concentration in three that share a supply route. She filters the review list by those three stores, reads the text rather than the stars, and sends the pattern to operations — not as a complaint, as evidence.
Before the May bank holiday she applies the reduced-hours schedule to the 74 stores that follow it, then runs the audit. Four stores still show the old hours because their profiles were edited by someone else the week before. She fixes those four and replies to the two customers who had already written about a closed door.
At the monthly meeting she puts the heat map on screen instead of the chain average. The average has not moved. Two districts have, and now there is a conversation about why.
- Unanswered negatives
- 24
- In two supplier-linked branches
- 9
- Hours edits flagged by Google
- 1
- Branches on late-night hours
- 14
Figures belong to the example above.
Related
Related pages
Features, sectors and reading that share the same work.
See it with your own locations
We will walk through your estate, your review volume and your current workflow.