



Reviews and reputation
Google review analytics for every branch
A chain average hides the branch losing a tenth of a star a quarter. Review analytics shows the distribution, the response time and the direction of travel per location, with one date range across every view.
Last updated:
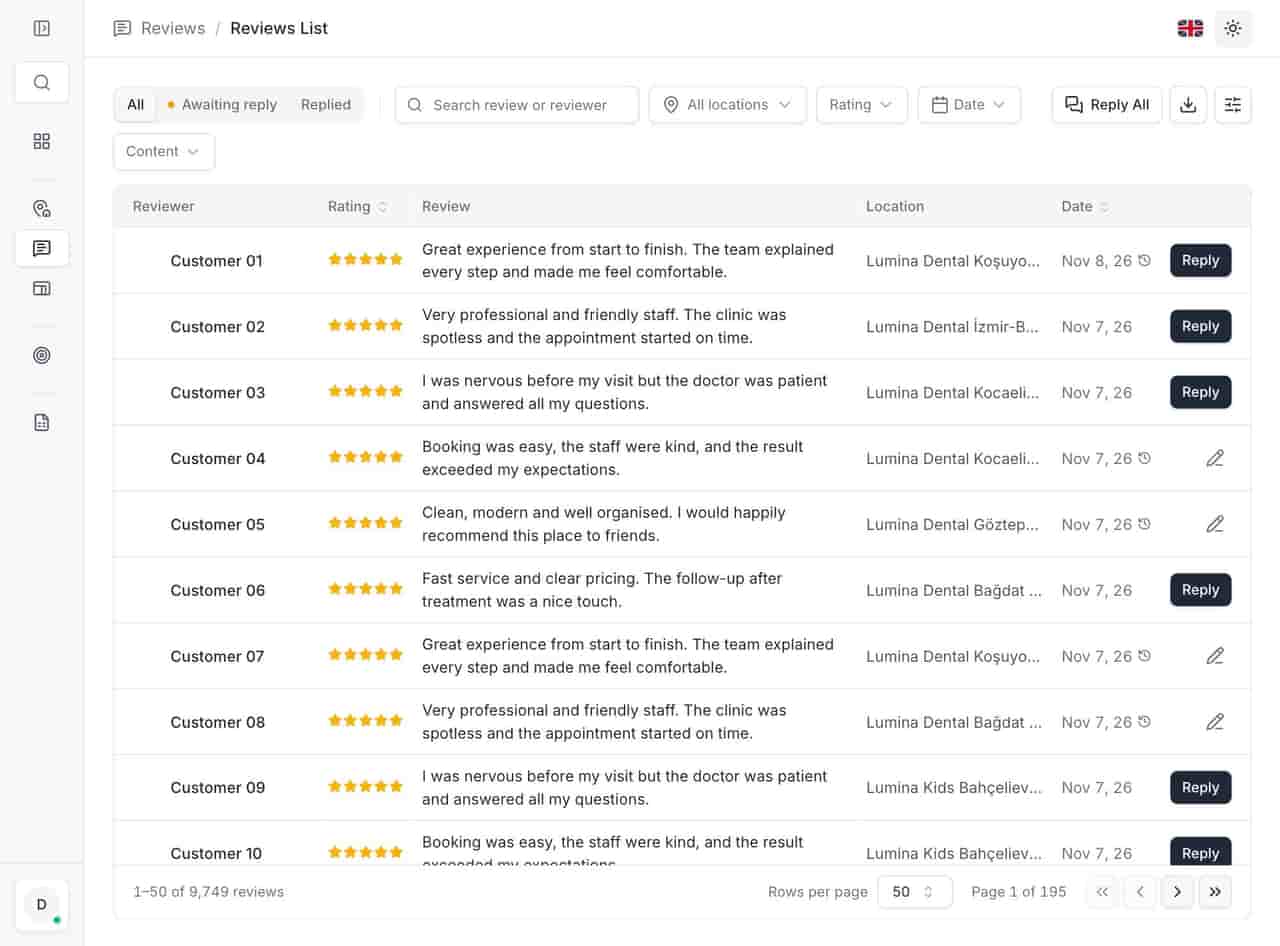
What is review analytics in Locationes?
The reporting layer that explains a rating instead of stating it. It covers current and period rating per location, the star split of incoming reviews, the share of 1–2★ reviews, unanswered negatives, average response time to a negative review, and a month-on-month comparison with target versus actual.
- Average rating in the account
- 4.87
- Share of reviews answered
- 99.4%
- Average time to answer a negative review
- 6.2 days
From the anonymized 23-location demo account, November 2026. Not a customer result.
What you get
- Share of 5★ and 1–2★, side by side.
- Unanswered negative reviews, counted rather than estimated.
- Average response time and 24-hour reply rate.
- Monthly star distribution, to show whether the mix is changing.
01Read the distribution, not just the score
Read the distribution, not just the score
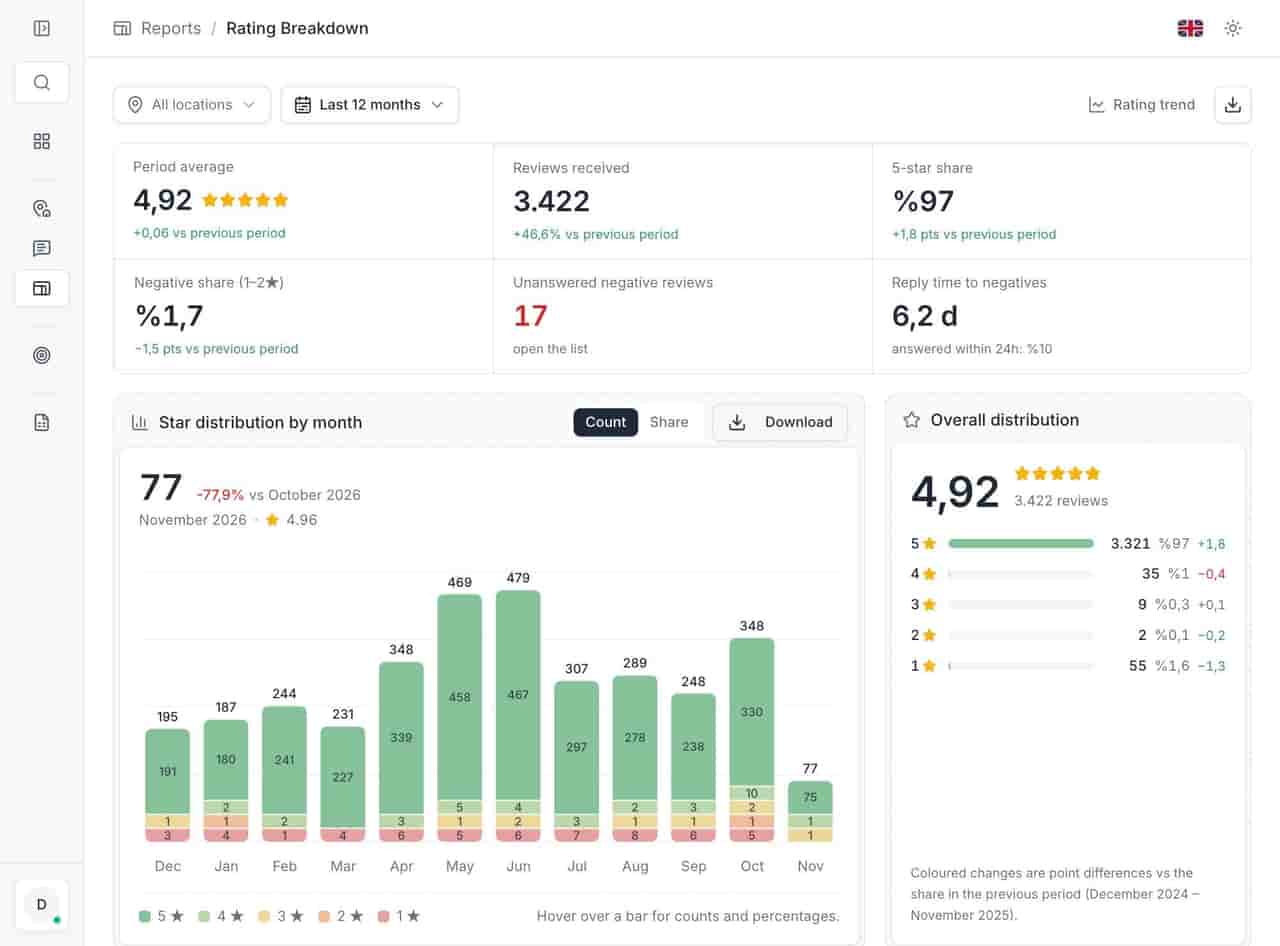
The rating breakdown answers "why is the average what it is". It shows the period average, incoming reviews, 5★ share, 1–2★ share, how many negative reviews remain unanswered, average time to answer one, and the share answered within 24 hours.
- Share of 5★ and 1–2★, side by side. - Unanswered negative reviews, counted rather than estimated. - Average response time and 24-hour reply rate. - Monthly star distribution, to show whether the mix is changing.
- Share of 5★ and 1–2★, side by side.
- Unanswered negative reviews, counted rather than estimated.
- Average response time and 24-hour reply rate.
- Monthly star distribution, to show whether the mix is changing. ../assets/screenshots/report-rating-breakdown-en.jpg — Alt: "Rating breakdown with period average, incoming reviews, 5-star and negative share, unanswered negatives and response time."
02Compare locations, not impressions of locations
Compare locations, not impressions of locations
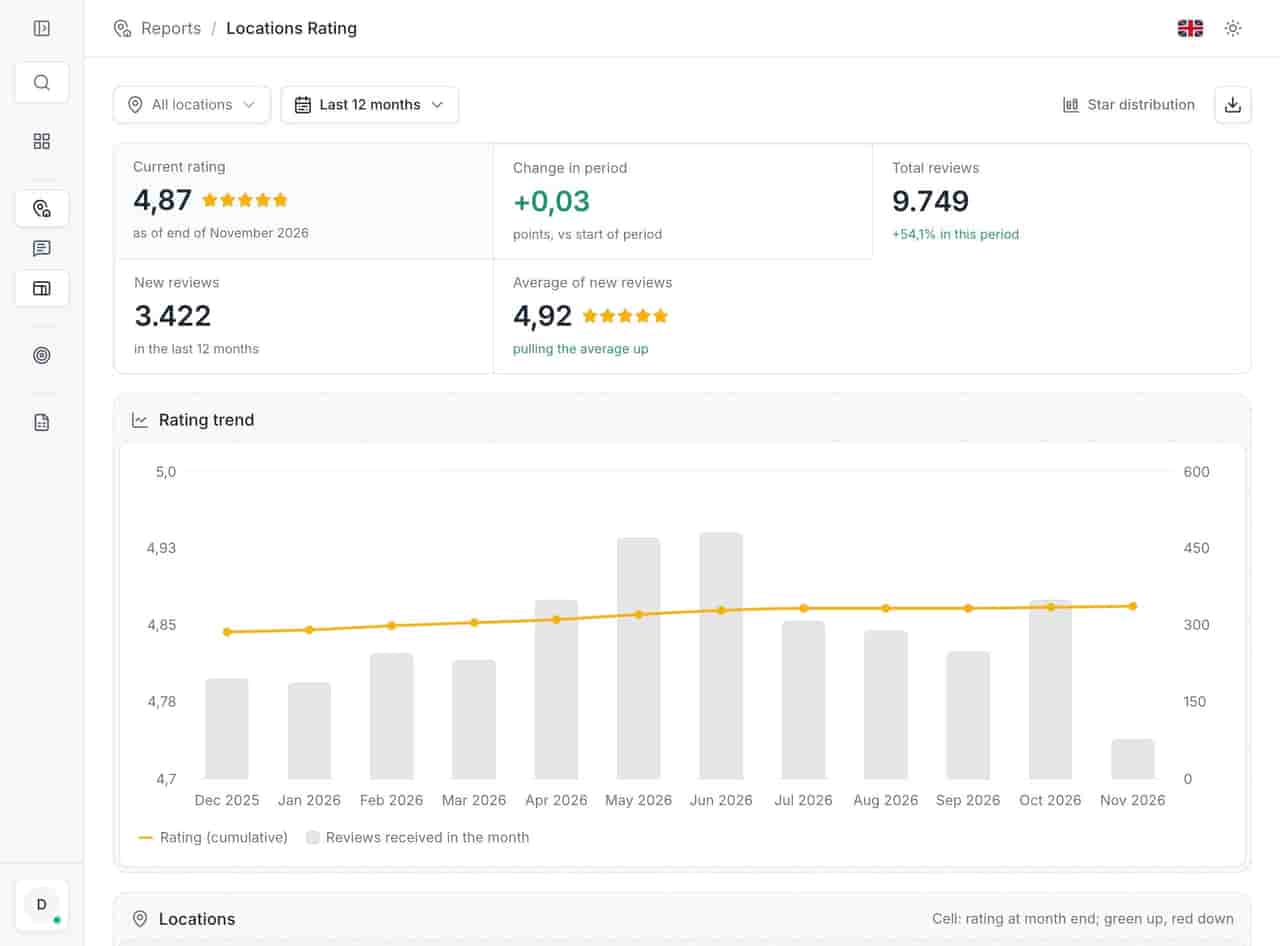
The location ratings report puts current rating, period change, total reviews, incoming reviews and the average of new reviews in one table. The column that matters is usually the change: a store at 4.6 and falling is a different conversation from one at 4.2 and rising.
- Current rating and change over the period. - Total reviews next to new reviews, so volume is visible. - Average of new reviews, which reacts faster than the lifetime rating.
- Current rating and change over the period.
- Total reviews next to new reviews, so volume is visible.
- Average of new reviews, which reacts faster than the lifetime rating. ../assets/screenshots/report-locations-rating-en.jpg — Alt: "Location ratings report with current rating, period change, total and incoming reviews and a development chart."
03Compare two months, star by star
Compare two months, star by star
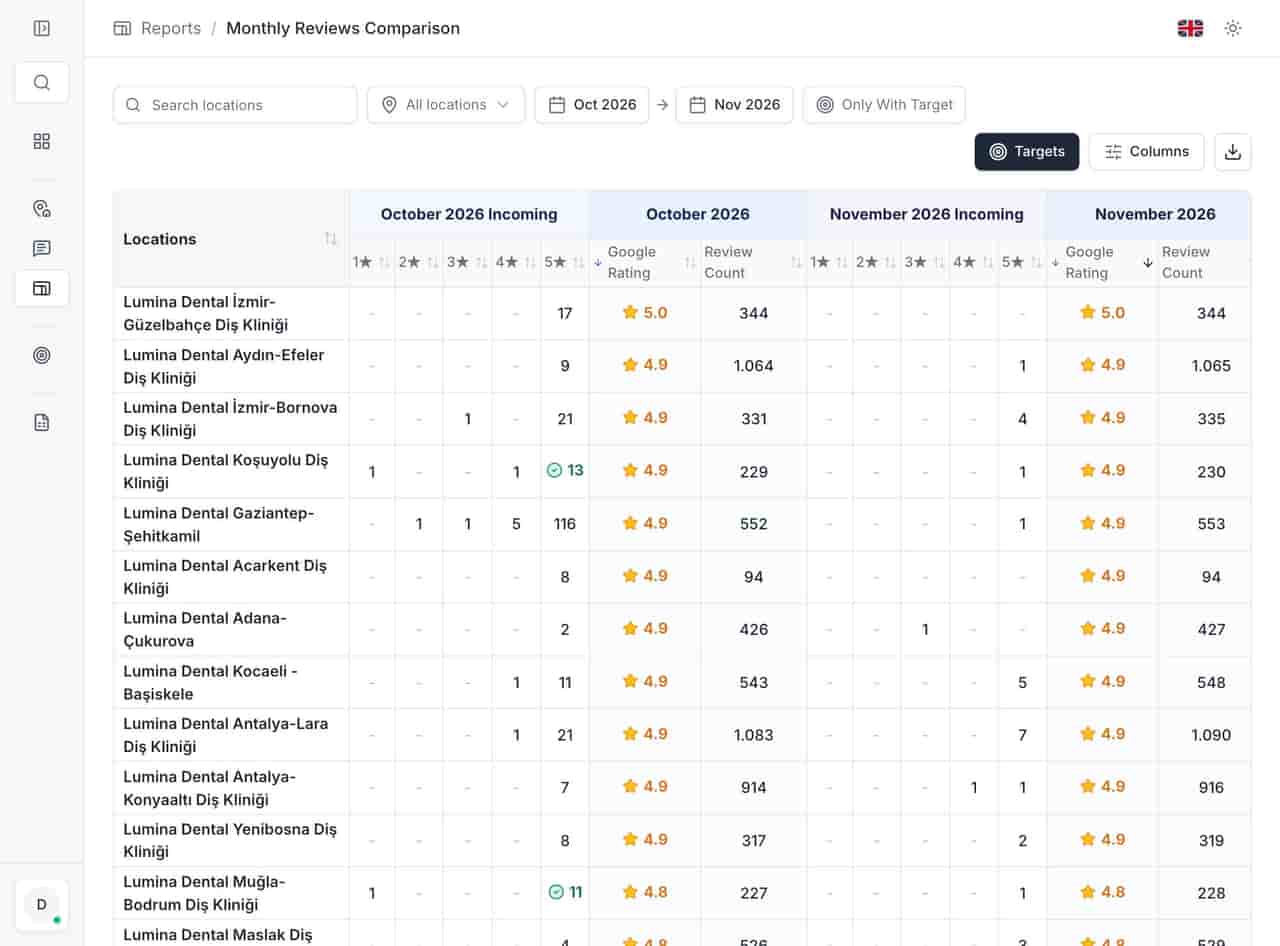
The monthly comparison is the management-meeting view: two months side by side, target versus actual per star, and the working rule that 5★ reviews should outnumber 1★ by at least five to one. It turns "reviews feel worse" into a row with a number in it.
- Two months side by side, not a twelve-month blur. - Target versus actual per star rating. - The five-to-one check applied per location.
- Two months side by side, not a twelve-month blur.
- Target versus actual per star rating.
- The five-to-one check applied per location. ../assets/screenshots/report-monthly-comparison-en.jpg — Alt: "Monthly comparison with two months side by side and target and actual counts per star rating."
Related
Related pages
Features, sectors and reading that share the same work.
FAQ
Review analytics questions
What counts as a negative review?
The 1–2★ band. Reports show its share of incoming reviews, how many are still unanswered and the average time to answer one — three figures that explain a falling average faster than reading the reviews.
Why compare two months rather than twelve?
Two months is what a store manager can act on: last month is close enough to have a cause. Longer movement lives in the rating development chart, where seasonality is easier to see.
What is the five-to-one rule?
A working target, not a Google rule: 5★ reviews should outnumber 1★ by at least five to one for a location to hold a healthy average. The monthly comparison shows target versus actual per star.
Can we export these reports?
Yes, to Excel, with the same date range and definitions. Large exports are queued and downloaded when ready, with a history of previous files.
Start with the queue you already have.
Connect one Google account and open the unanswered tab. Three days is enough to see whether the backlog is smaller on Monday.