



Reviews and reputation
Google review heat map across your estate
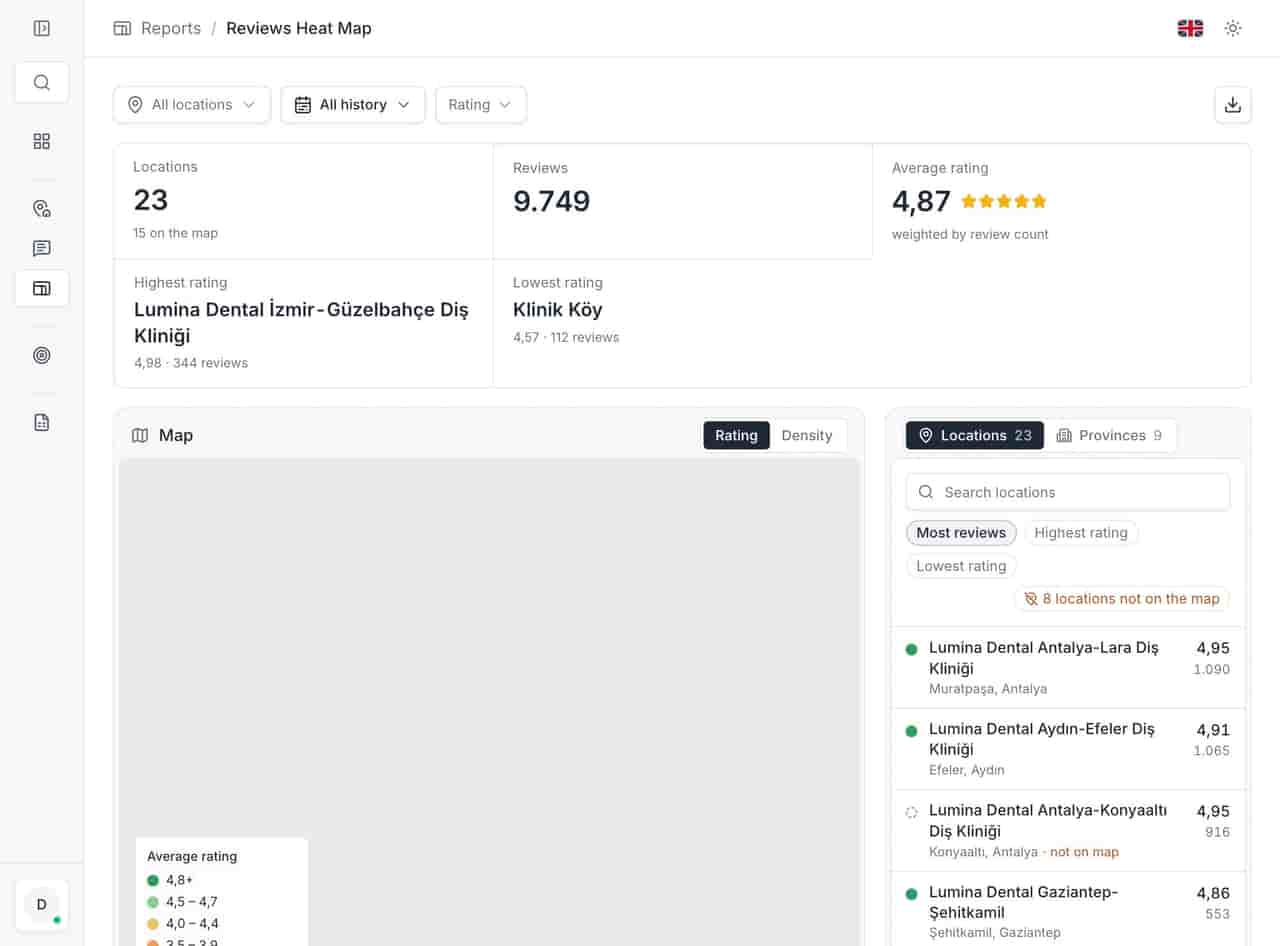
Ratings plotted on a map, coloured by score, filterable by band. One screen shows whether the weak locations are scattered or sitting next to each other — the question a forty-row table answers badly.
Last updated:
What is reviews heat map in Locationes?
Each location becomes a bubble on a map, coloured by its rating in the selected period, with a filter to isolate a band. It uses the addresses already on your Google Business Profiles, so no extra import is needed, and it reveals geographic patterns that averages and tables conceal.
- Locations plotted
- 23
- Average rating across them
- 4.87
- Reviews behind the colour
- 9,749
From the anonymized 23-location demo account, November 2026. Not a customer result.
What you get
- One bubble per location, coloured by rating.
- Clusters visible without filtering.
- The same location list as the rest of the product.
- Filter by rating band.
01Plot the estate
Plot the estate
Colour carries the rating, position carries the truth a table hides: four of your five weakest stores can sit inside one delivery route or one shopping centre, and the chain average will never mention it.
- One bubble per location, coloured by rating. - Clusters visible without filtering. - The same location list as the rest of the product.
- One bubble per location, coloured by rating.
- Clusters visible without filtering.
- The same location list as the rest of the product. ../assets/screenshots/report-heatmap-en.jpg — Alt: "Map view with a bubble per location, coloured by rating, and a rating filter panel."
02Filter to the band that needs attention
Filter to the band that needs attention
The rating filter is the control that makes the map useful. Remove the 4★ and 5★ locations and what remains is a work list: which stores are below the line, and whether they are near each other.
- Filter by rating band. - Respects the region and category filters used elsewhere. - Combine with the period selector for a quarter view.
- Filter by rating band.
- Respects the region and category filters used elsewhere.
- Combine with the period selector for a quarter view. ../assets/screenshots/report-heatmap-en.jpg — Alt: "Heat map filtered to locations below the rating threshold."
03Go from cluster to store
Go from cluster to store
A cluster is a hypothesis. Open a location to test it: reviews, rating trend, profile score and the action list sit behind the bubble. The usual finding is either a shared cause — a mall, a road, a delivery hub — or three unrelated stores that happen to be nearby.
- Open the location behind any bubble. - Read its recent reviews and rating trend. - Decide whether the fix is local or regional.
- Open the location behind any bubble.
- Read its recent reviews and rating trend.
- Decide whether the fix is local or regional. ../assets/screenshots/report-heatmap-en.jpg — Alt: "Location detail reached from the map, with reviews and profile score."
Related
Related pages
Features, sectors and reading that share the same work.
FAQ
Reviews heat map questions
What does the colour represent?
The location's rating in the selected period, on a low-to-high scale. Size and clustering make density readable; the rating filter is the control that matters most, because it removes the stores that are fine.
Does the map need location data to be complete?
It uses the addresses already on your Google Business Profiles, so no extra import is required. A wrong address plots in the wrong place — a useful signal, since the same error affects directions.
Can we filter by region as well as rating?
The map respects the location filters used elsewhere in the reports, so you can narrow to a region or category before reading the pattern. For a single market review that is usually enough.
Is it live data?
It reflects the reviews stored for the selected period, not a live feed. Google data settles with a delay of about five days, so a map of the last week can still change.
Start with the queue you already have.
Connect one Google account and open the unanswered tab. Three days is enough to see whether the backlog is smaller on Monday.