



Google review benchmarks you can defend in a board meeting
How to set review targets a board will accept: response time, reply rate, rating drift and deletion rate, with the numbers that show the work landed.
Last updated:
Someone asks for "a good review rating" and the room waits for a number. 4.5? 4.8? The industry average for our category? The honest answer is that a published benchmark is almost never comparable to your estate, and a borrowed target cannot be defended when it is missed.
A defensible target is built from your own locations, over a defined period, with definitions written down. It is less exciting and far more useful: it survives a challenge from finance and a change of agency.
What is a review benchmark?
The word usually means "what other businesses achieve" — interesting, rarely actionable. What you need is a baseline you trust and a step you can fund.
Why industry averages fail
A single average for "restaurants" or "clinics" hides every variable that decides your number:
- Mix. A chain with 200 reviews per store sits in a different distribution from a single site with 40. The average blends them.
- Solicitation. Businesses that ask every customer at checkout and businesses that ask nobody are averaged together, as if the input were the same.
- Listing age. A listing open for ten years carries a different history from one opened last spring, even with identical service.
- Market. Review culture differs by country and city. A target copied across markets is a target one market cannot hit.
- Category mix inside a brand. A dental group with orthodontics, emergency care and cosmetic work has three different review populations under one logo.
None of this makes an external figure evil. It makes it a conversation starter, not a target. If you need a number for a board slide, it should come from your own data.
Build a baseline in 90 days
Ninety days smooths a holiday and stays current. Pull data per location, not per brand.
| Metric | Definition to write down | Why it matters |
|---|---|---|
| Reply rate | Reviews with a public reply divided by reviews received in the period | Shows whether anyone is working the queue |
| Negative reply time | Median days from a 1–2★ review to its first reply | The number customers feel |
| 1–2★ share | 1–2★ reviews divided by all reviews received in the period | Quality signal, independent of the average |
| Review velocity | New reviews per month per location | Whether the sample is large enough to read |
| Removal rate | Reviews removed by Google divided by reviews received | Whether the rating is partly a removal statistic |
Write the definitions in the same document as the numbers. Most arguments about review performance are arguments about which reviews count, which date range is used, and whether a reply in the wrong language still counts. Settle that once.
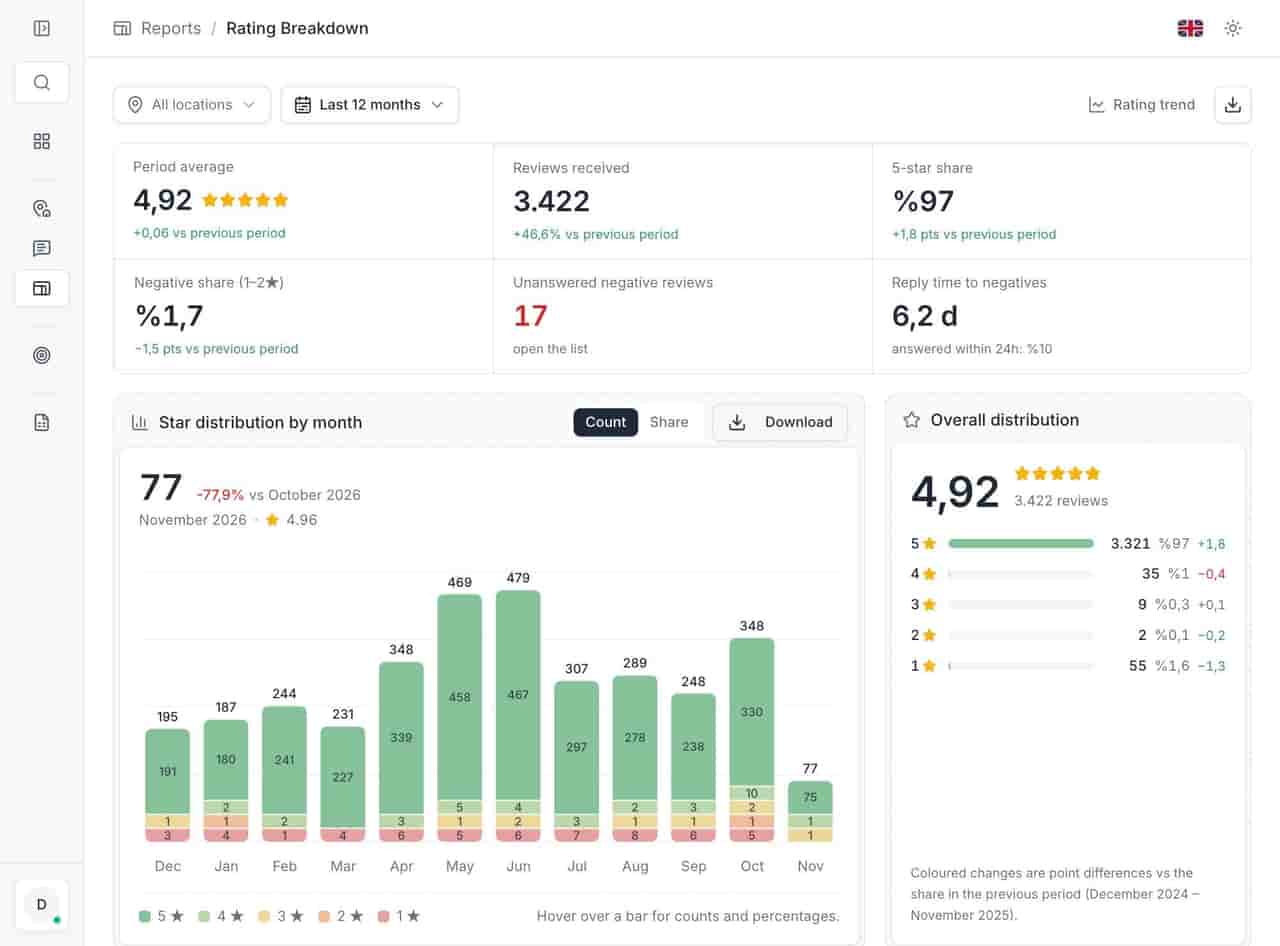
In the anonymized 23-location demo account, the reply rate is 99.4%, the average rating is 4.87, and the median time to answer a negative review is 6.2 days. Those are sample figures from one account, not a benchmark; they are useful because they show a realistic shape: strong replies, weak negative response time.
The three numbers worth putting on a slide
1. Reply rate
The simplest and the least gameable. Count reviews received in the period, count those with a reply, divide. Do not count unpublished replies or a template sent to the wrong location.
A high reply rate with a slow negative response time means the team answers the easy reviews and avoids the hard ones. Read the two together.
2. Time to first reply on a negative
Use the median, not the average: one review answered after three weeks can distort a mean. Set the clock from the review's timestamp, not from when it appeared in your inbox.
This is the metric most worth improving first, because it is the one a customer experiences. A 6.2-day median is not a crisis; it is an improvement opportunity with a clear owner. A two-day target is a staffing decision: calculate the reviews per week and who answers on a Saturday.
3. The 5★ to 1★ ratio
The average hides distribution. A 4.6 of mostly 5s and a few 1s differs from a 4.6 of 4s. The monthly comparison report in the product uses a simple starting rule: five-star reviews should outnumber one-star reviews by at least five to one.
That rule is a working threshold, not an industry law. It is useful because it forces the conversation onto the shape of the distribution, where operations can act.
Turn a baseline into a target
Use a formula, not a wish:
- Start from the baseline. Median negative reply time: 6.2 days.
- Choose one step, not a leap. Two business days is a step; same-day is a redesign.
- Cost the step. Count negative reviews per week across the estate. Multiply by the minutes a good reply takes, including reading the review and checking the facts. That is the capacity you need.
- Assign one owner per location. A queue without a name is a hope.
- Set the review date. Ninety days, same definition, same date range.
- Write what would make the target wrong. A new location, a rebrand, a change of agency. If one happens, the baseline resets and the board should know before the number does.
Targets should be few. Three metrics per quarter is enough to run; ten is a dashboard nobody reads.
The board slide
One slide, five rows, no logo collage.
| Metric | Definition | Baseline | Target | Owner |
|---|---|---|---|---|
| Reply rate | Replied ÷ received, quarter | 99.4% | Hold above 95% | Head of CX |
| Negative reply time | Median days, 1–2★ | 6.2 | 3.0 | Regional managers |
| 1–2★ share | 1–2★ ÷ received | Current quarter | Down 2 points | Operations |
| Review velocity | New reviews per store per month | Current quarter | Stable or up | Marketing |
| Removal rate | Removed ÷ received | Current quarter | Reported, not targeted | Analytics |
Two details make it credible: the definitions column, and the fact that removal rate is reported rather than targeted. Nobody should be incentivised to make reviews disappear, and saying so prevents the question.
What not to do with review targets
- Do not use an unsourced industry average. If a number has no denominator, it is decoration.
- Do not target the star rating alone. It moves slowly, it is affected by removals, and it gives operations nothing to do on Monday.
- Do not reward review volume without a quality check. It invites gating, incentives and fake reviews, all policy risks.
- Do not set a target the team cannot staff. A two-day reply target with no weekend cover is a target designed to fail.
- Do not change the definition mid-quarter. A moving definition makes every result arguable.
- Do not hide the removal rate. A rising average with a high low-star removal rate is a reporting problem, not a success.
Checklist before you agree a target
- Baseline covers 90 days and every location.
- Definitions are written and match the reports.
- The date range is the same across metrics.
- Negative reply time uses the median.
- The target is one step from baseline.
- Capacity is calculated in replies per week.
- Every location has a named owner.
- The removal rate is reported beside the rating.
- A review date and a reset condition are agreed.
A target that survives the follow-up question
The test of a review target is not whether it sounds ambitious. It is whether you can answer "why this number?" without reaching for a blog post. A baseline from your own estate, a definition anyone can reproduce and a step you have costed will survive that question.
If the weak metric is response time, the fix is a queue and approved wording: review management and the reply rules. If the concern is whether the rating is honest, read it beside the deleted reviews report. For a clinic group, the clinic guide sets the reply boundary.
Review analytics gives every location the same definitions and one date range, which is the only basis on which a board target should be set.
Questions, answered.
What is a good Google review rating?
Should review targets include the star rating?
How long should a baseline cover?
See how the deleted reviews archive keeps the record, including the reply.
FeaturesKeep reading
Related
Related pages
Features, sectors and reading that share the same work.