



Visibility and reporting
Google Business Profile impressions: what the numbers mean
Two numbers, often confused: how often a location appeared, and what people did next. Read together they show whether profile work reached customers, and which store is seen without being chosen.
Last updated:
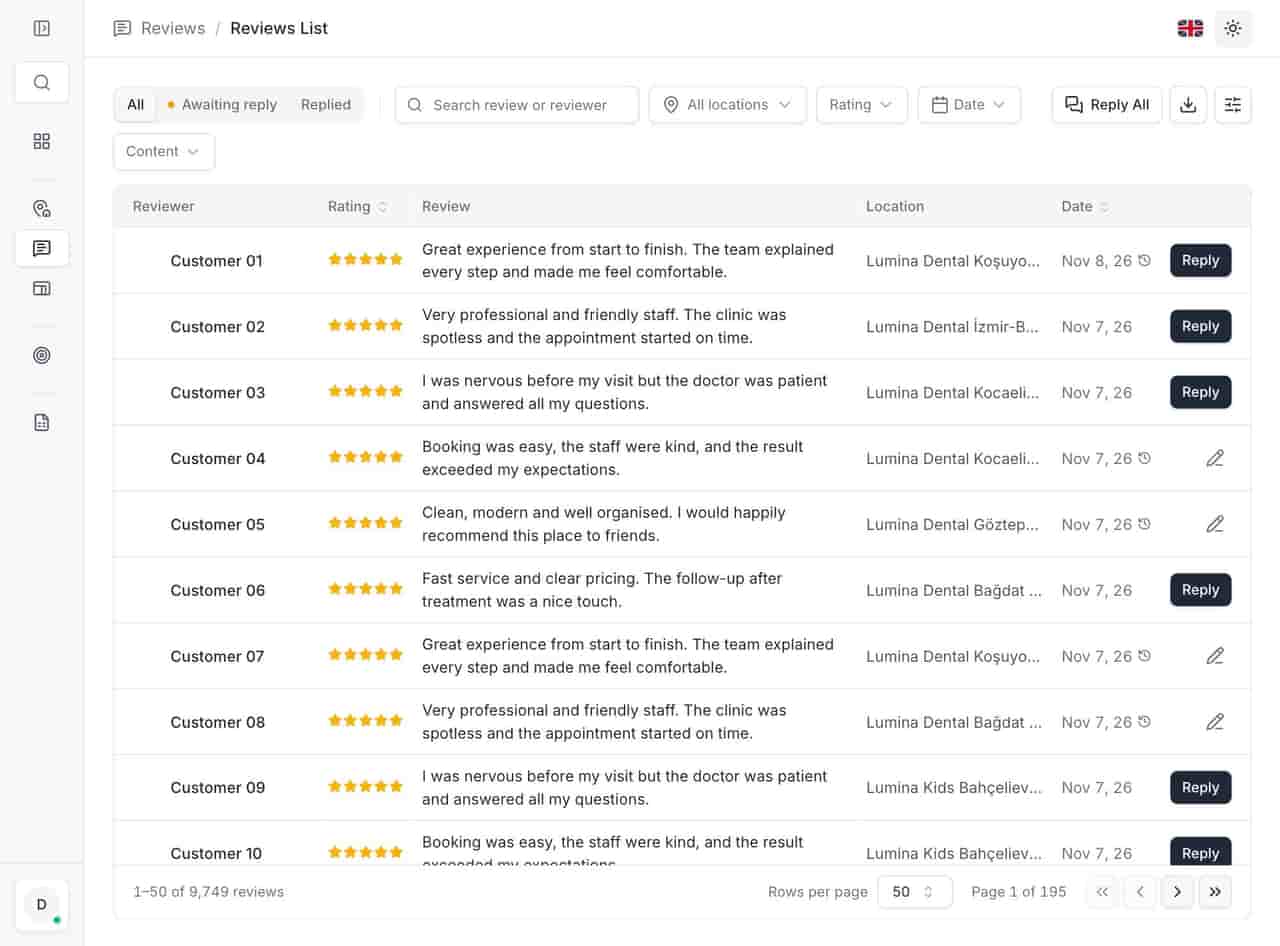
What is impressions and interactions in Locationes?
Impressions are the times a location appeared in Google search and maps, split by mobile and desktop. Interactions are the actions that followed: website clicks, direction requests and calls. Reported together, they separate being visible from being useful, and show where the drop happens.
- Impressions in 30 days
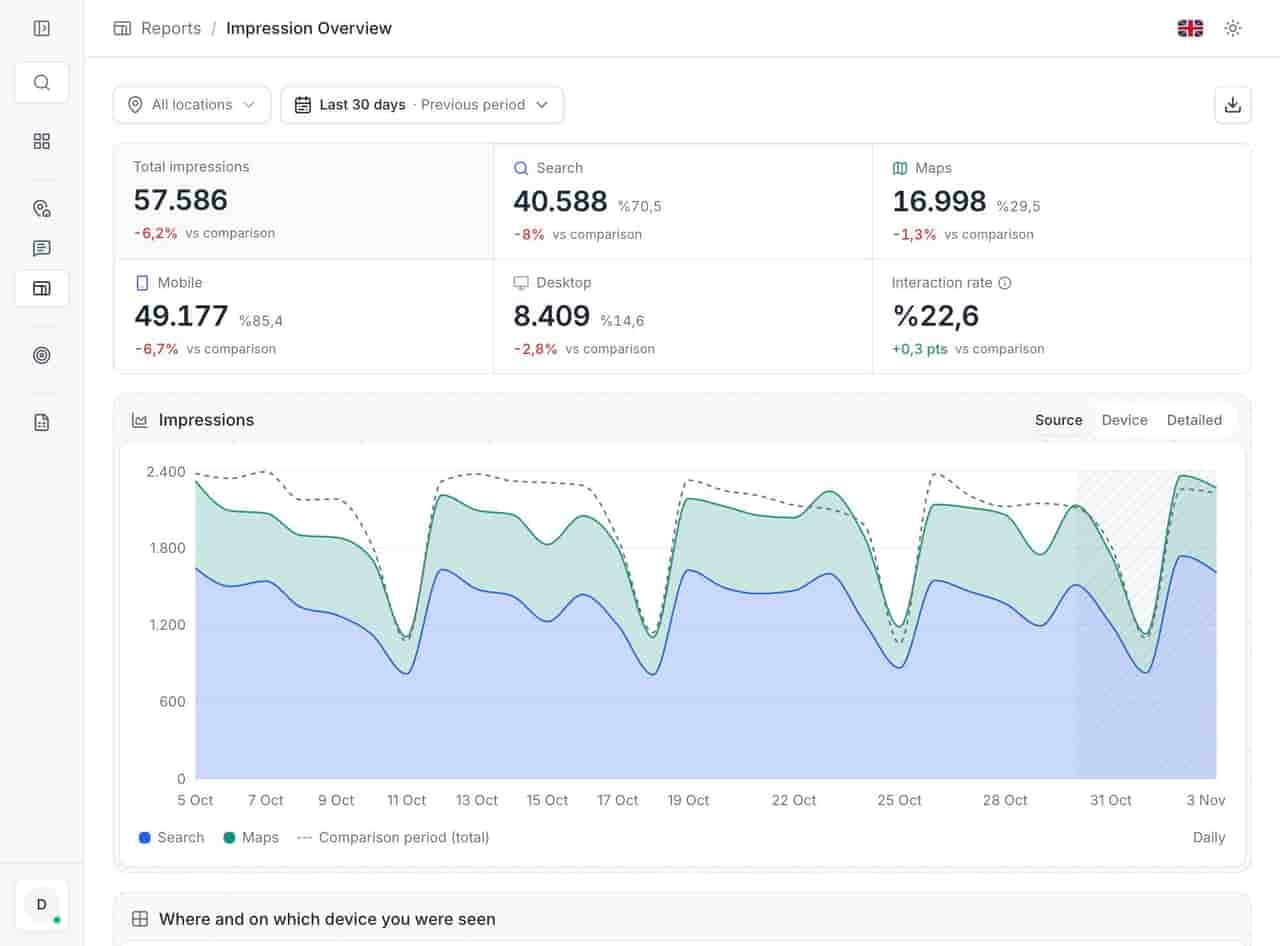
- 57,586
- Interactions in the same period
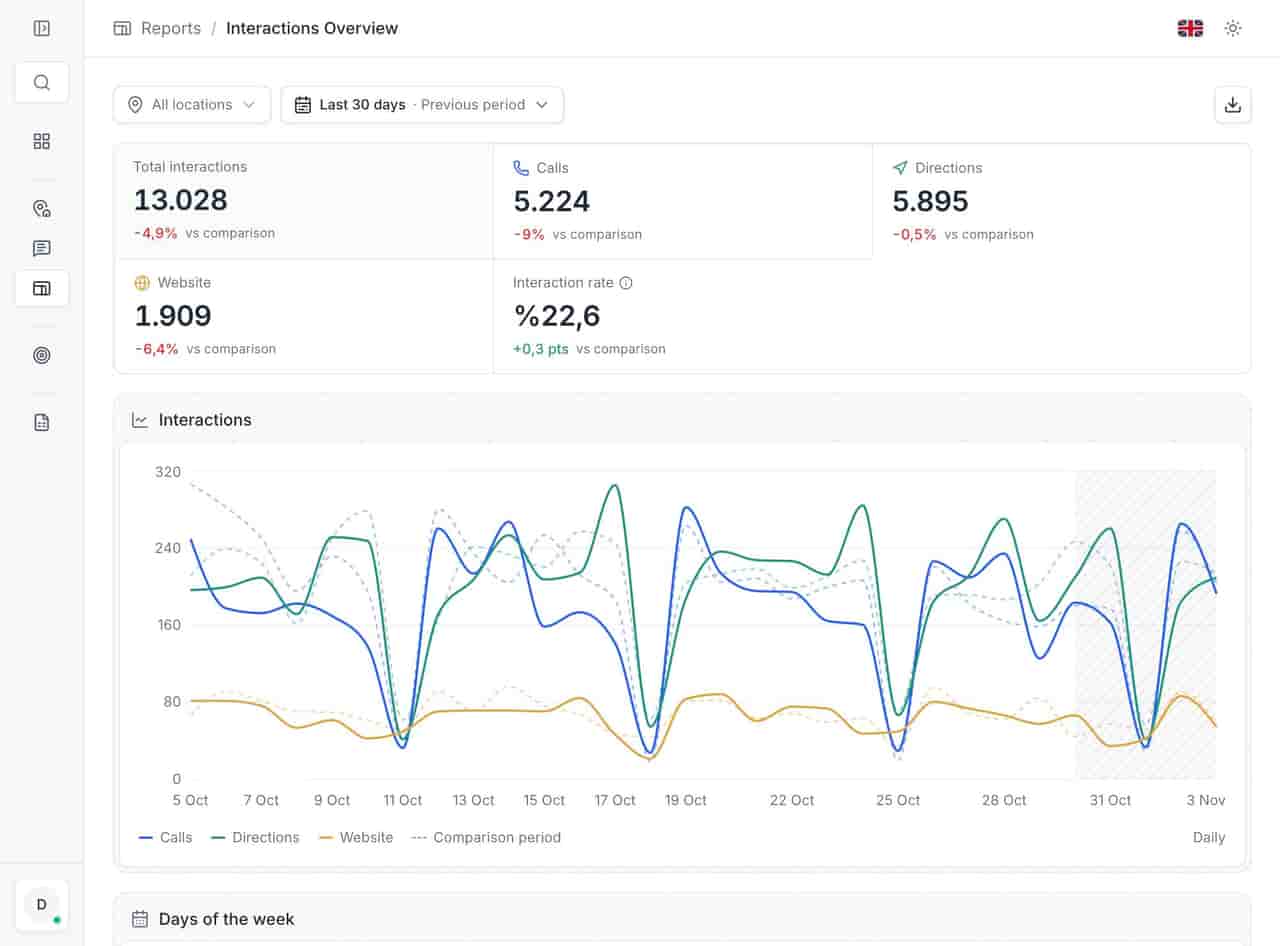
- 13,028
- Locations in the report
- 23
From the anonymized 23-location demo account, November 2026. Not a customer result.
What you get
- Total impressions with previous-period comparison.
- Search versus maps, mobile versus desktop.
- Interaction rate alongside the volume.
- Weekday breakdown, for staffing and posting.
01Impressions tell you where you are seen
Impressions tell you where you are seen
The report splits the total by search and maps, and by mobile and desktop, then repeats the split per location. A maps-heavy pattern usually means people already nearby; a search-heavy pattern means people comparing options. The two need different profile work.
- Total impressions with previous-period comparison. - Search versus maps, mobile versus desktop. - Interaction rate alongside the volume. - Weekday breakdown, for staffing and posting.
- Total impressions with previous-period comparison.
- Search versus maps, mobile versus desktop.
- Interaction rate alongside the volume.
- Weekday breakdown, for staffing and posting. ../assets/screenshots/report-impressions-en.jpg — Alt: "Impressions overview with total, search and maps breakdown, mobile and desktop split and a per-location table."
02Interactions tell you what it was worth
Interactions tell you what it was worth
The interactions report splits the total into website clicks, direction requests and calls, with a daily chart and a weekday view. It is the honest half of the pair: a store can double its impressions and still send the same number of people to the door.
- Website clicks, directions and calls, separately. - A daily chart that shows campaigns and outages. - Per-location interaction rate, not just volume.
- Website clicks, directions and calls, separately.
- A daily chart that shows campaigns and outages.
- Per-location interaction rate, not just volume. ../assets/screenshots/report-interactions-en.jpg — Alt: "Interactions overview with website clicks, direction requests, calls, daily chart and weekday breakdown."
03Compare rates, then read the rhythm
Compare rates, then read the rhythm
Volume follows the size of the store; the rate shows whether the listing convinces. Sorting locations by interaction rate rather than impressions produces a more useful conversation, and the weekday pattern explains why a Saturday promotion performed differently from a Tuesday one.
- Rate first, volume second. - Same date range as every other report. - Previous-period comparison by default.
- Rate first, volume second.
- Same date range as every other report.
- Previous-period comparison by default. ../assets/screenshots/report-interactions-en.jpg — Alt: "Weekday breakdown of interactions, used for staffing and promotion timing."
Related
Related pages
Features, sectors and reading that share the same work.
FAQ
Impressions & interactions questions
What counts as an interaction?
The actions Google records after someone sees a location: website clicks, direction requests and calls. They are reported separately so you can tell a research visit from someone about to drive.
Why do the last few days look low?
Google finalises performance data with a delay of about five days, so recent figures can still increase. Locationes shows what it has and does not estimate the missing days.
Can we compare two locations directly?
Yes, through the location table in both reports. Sorting by interaction rate rather than volume is usually more useful, because a small store with a high rate is doing something a large store is not.
Is this the same data as the Google dashboard?
The same underlying Google data, presented across locations with one date range and one definition. The value is comparison and export, not a second source of truth.
Start with the queue you already have.
Connect one Google account and open the unanswered tab. Three days is enough to see whether the backlog is smaller on Monday.