



Visibility and reporting
Local keyword trends, month by month
One bad month is noise; four falling months is a signal. Keyword trends shows how each term moved, when it started, and which locations moved with it — as a heat map, a month view and a filtered table.
Last updated:
What is keyword trends in Locationes?
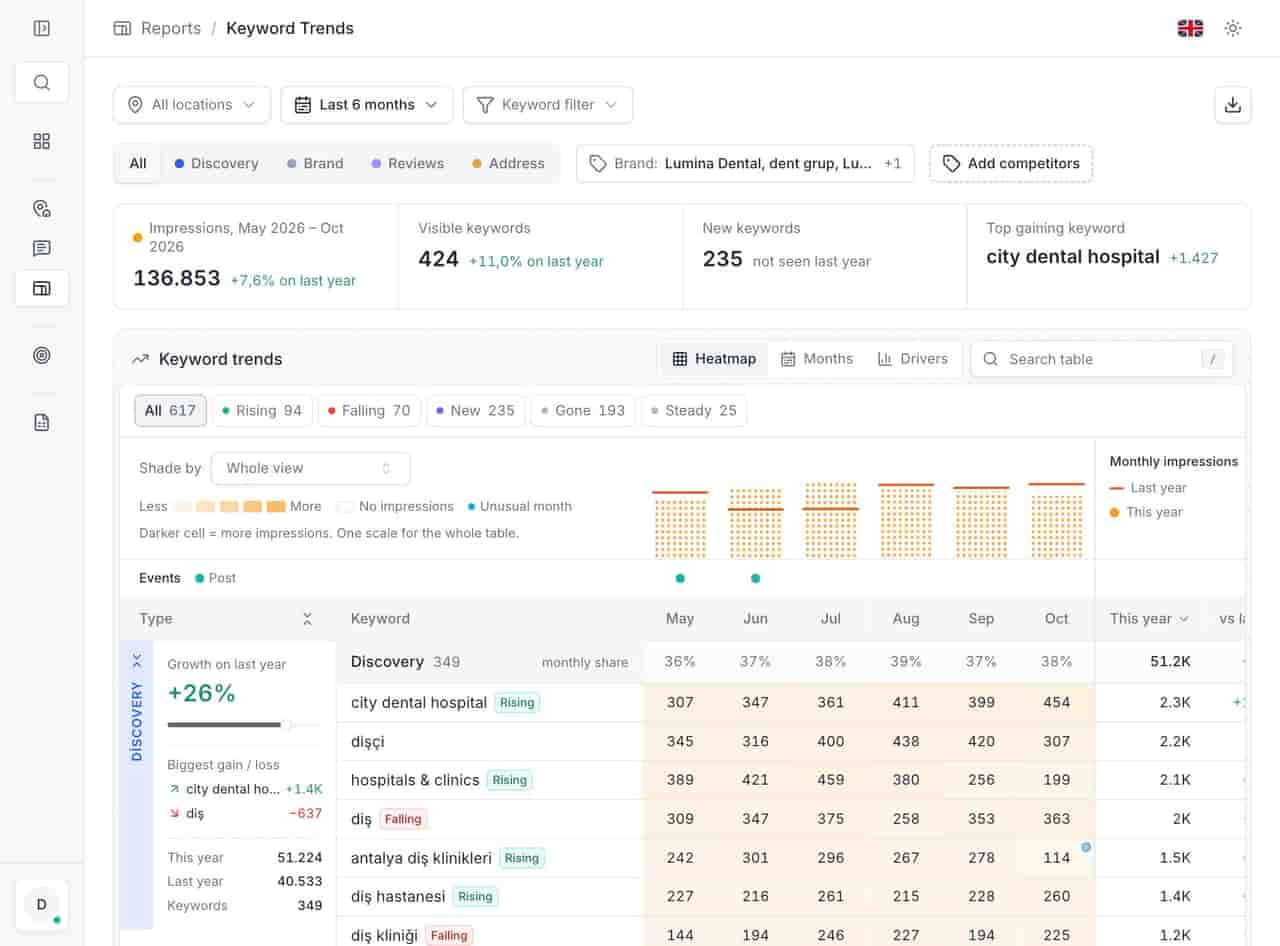
The time dimension of local search visibility. It takes the terms your locations appeared for and shows their direction over months, grouped as rising, falling, new, lost or stable on a colour scale. Three views answer three questions: where the change is concentrated, when it started, and what moved alongside it.
- Visible keywords tracked
- 424
- Impressions behind them, six months
- 136,853
- Locations represented
- 23
From the anonymized 23-location demo account, November 2026. Not a customer result.
What you get
- Estate-wide drops and single-store drops look different.
- Seasonal patterns repeat in the same columns.
- New terms appear as colour before they appear in a report.
- One term, one line, every month in the period.
01Read the heat map before the table
Read the heat map before the table
Rows are keywords, columns are months, colour is direction and size of change. The value is pattern recognition: a month where everything fell looks nothing like one store losing ten terms. It is the view that survives being projected in a meeting.
- Estate-wide drops and single-store drops look different. - Seasonal patterns repeat in the same columns. - New terms appear as colour before they appear in a report.
- Estate-wide drops and single-store drops look different.
- Seasonal patterns repeat in the same columns.
- New terms appear as colour before they appear in a report. ../assets/screenshots/report-keyword-trends-en.jpg — Alt: "Keyword trends heat map with months as columns, keywords as rows and a colour scale for growth and decline."
02Switch to months for the actual shape
Switch to months for the actual shape
The months view follows one keyword. A step change suggests a profile edit, a category change or a new competitor; a slow decline suggests seasonality or gradual loss of relevance. Reading the shape separates a cause from a coincidence.
- One term, one line, every month in the period. - Step changes flagged against the month they occurred. - Comparable across locations that should behave alike.
- One term, one line, every month in the period.
- Step changes flagged against the month they occurred.
- Comparable across locations that should behave alike. ../assets/screenshots/report-keyword-trends-en.jpg — Alt: "Month-by-month view of a single keyword's movement."
03Filter to the list you can act on
Filter to the list you can act on
Nobody acts on 424 keywords. The filters — rising, falling, new, lost, stable — reduce the set to the ten worth a conversation, and table search finds a term you already suspect. That is the loop: filter, read, assign.
- Five states: rising, falling, new, lost, stable. - Table search for a term you were asked about. - Location context for every row.
- Five states: rising, falling, new, lost, stable.
- Table search for a term you were asked about.
- Location context for every row. ../assets/screenshots/report-keyword-trends-en.jpg — Alt: "Keyword trend table filtered to falling terms."
Related
Related pages
Features, sectors and reading that share the same work.
FAQ
Keyword trends questions
What is the difference between the heat map and the months view?
The heat map shows many keywords at once and is best for clusters — a month where everything fell, or one store that lost ten terms. The months view follows a single keyword, better for judging a trend versus a one-off.
What do "new" and "lost" mean?
New means the location started appearing for a term; lost means it stopped. Both are counted separately from rising and falling, because a term going from nothing to a few impressions is not a doubling.
Can we see trends per location?
Yes. The table shows which locations each term appears for, and the report respects the location filter. Comparing two stores in similar areas separates a local issue from a market-wide one.
Is the data delayed?
Google finalises performance data with a delay of about five days, so recent days can still change. Trends are most reliable when the period ends at least a week in the past.
Start with the queue you already have.
Connect one Google account and open the unanswered tab. Three days is enough to see whether the backlog is smaller on Monday.